Minimap View
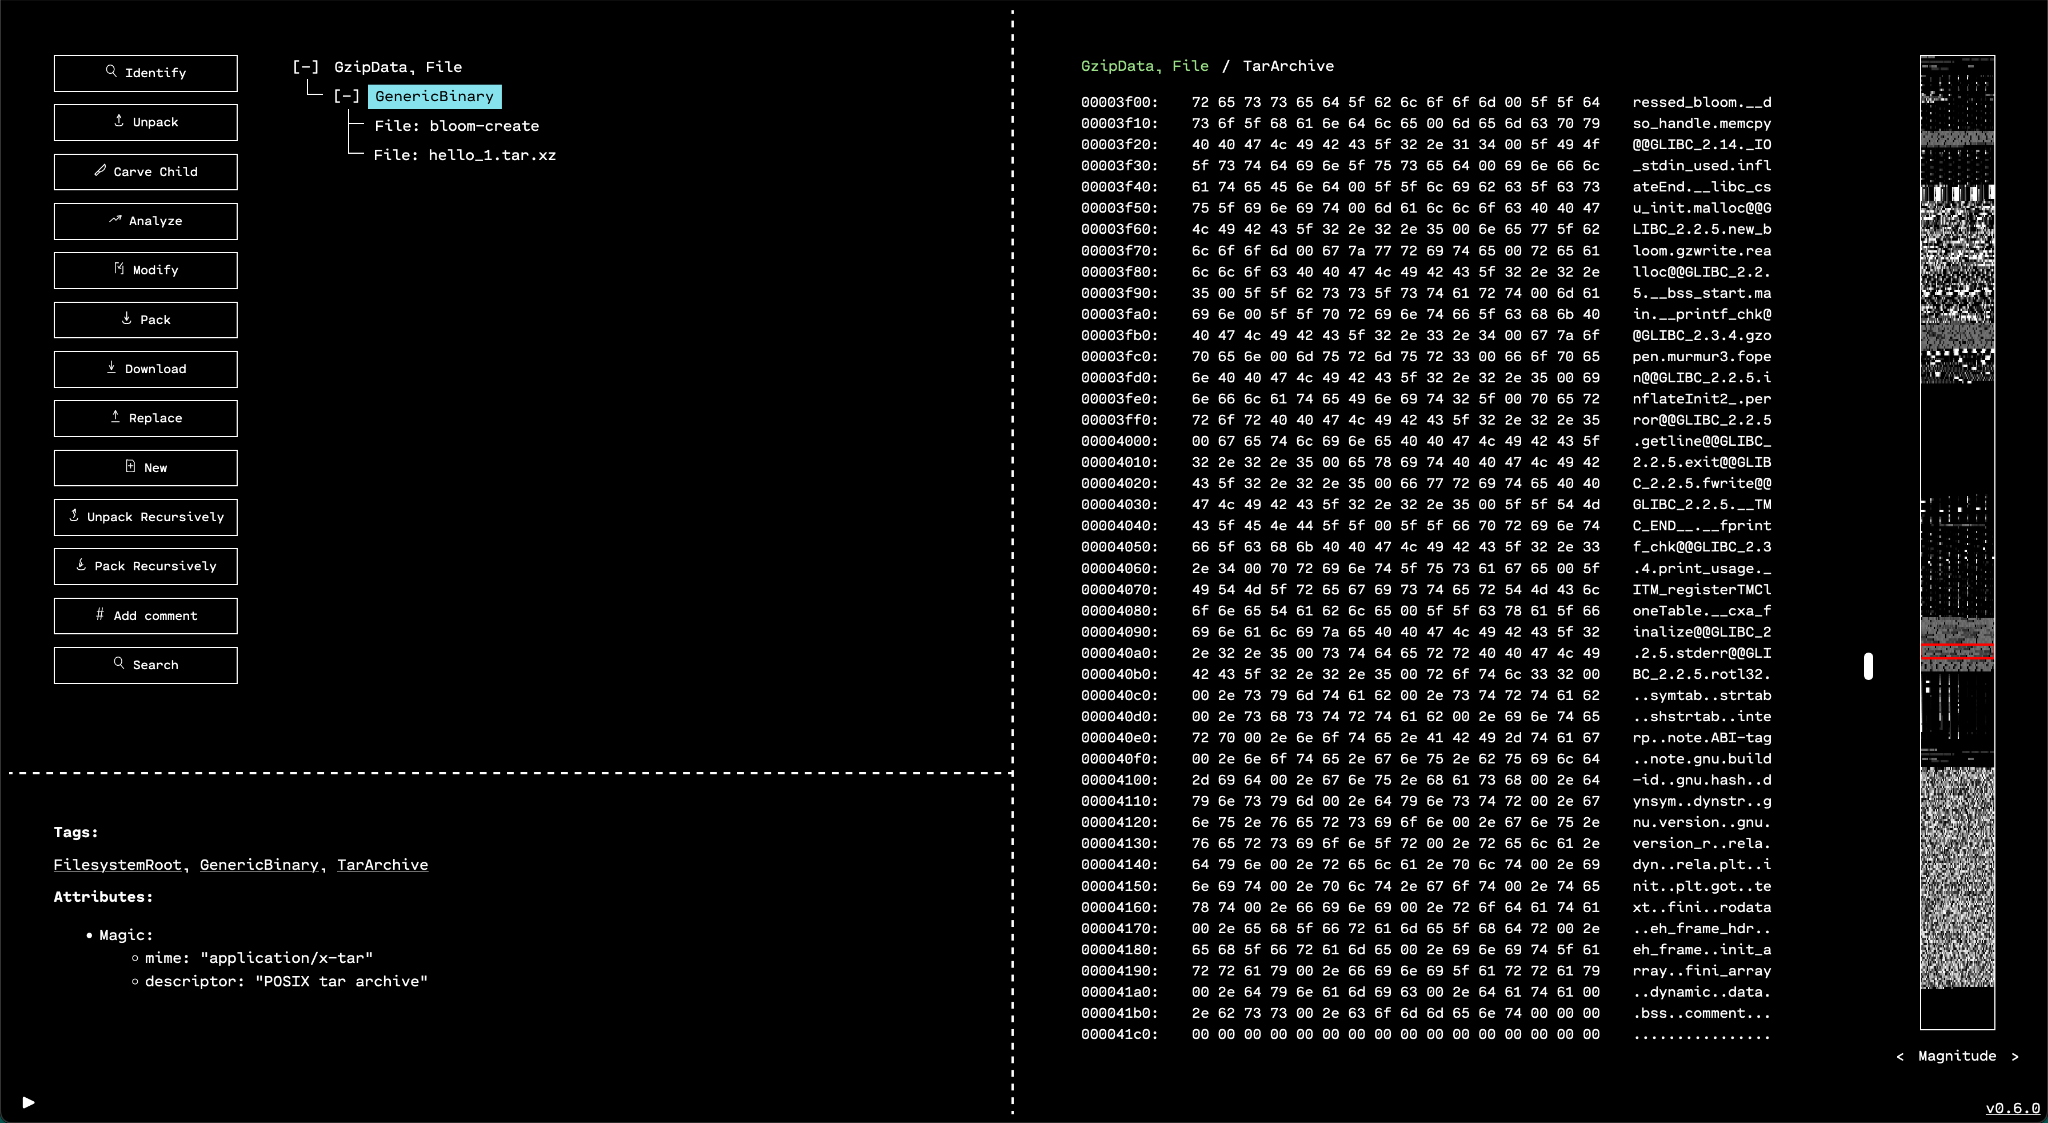
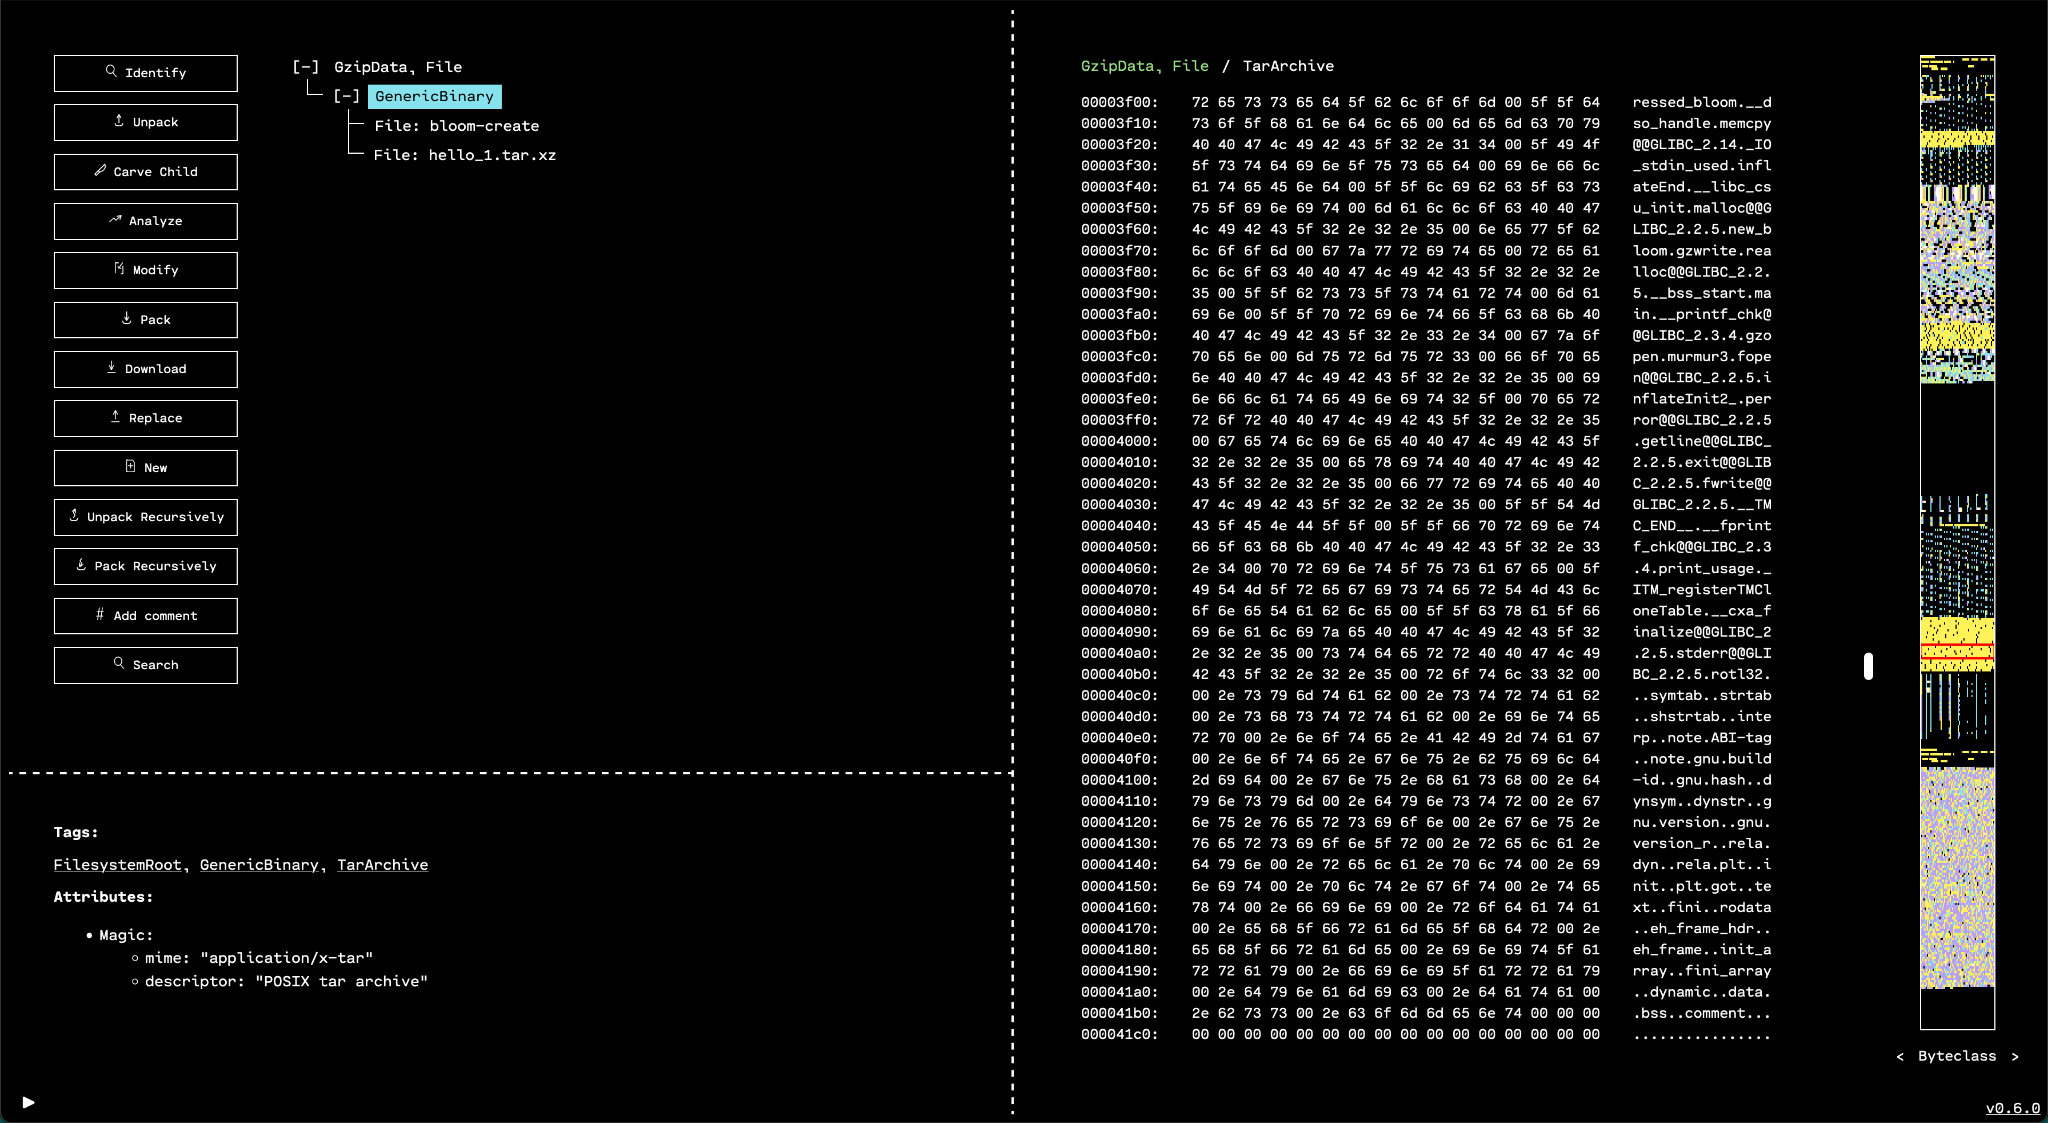
The “minimap view” (“minimap” for short) on the far right of the GUI (see figure below) is one way OFRAK helps users. The minimap visually represents all the data of a selected binary. Each pixel in the minimap corresponds to one byte of the resource's binary data, with the color of each pixel determined by the corresponding byte.
The minimap accelerates exploring and navigating to the most important parts of the binary. Unlike the hex view (directly to the left of the minimap), which only shows a portion of a resource's binary data at a time, the minimap provides a bird's eye view of the entire resource.
Clicking the minimap scrolls the hex view to the corresponding part of the data. A red box overlaid on the minimap shows what part of the data the hex view is currently displaying.
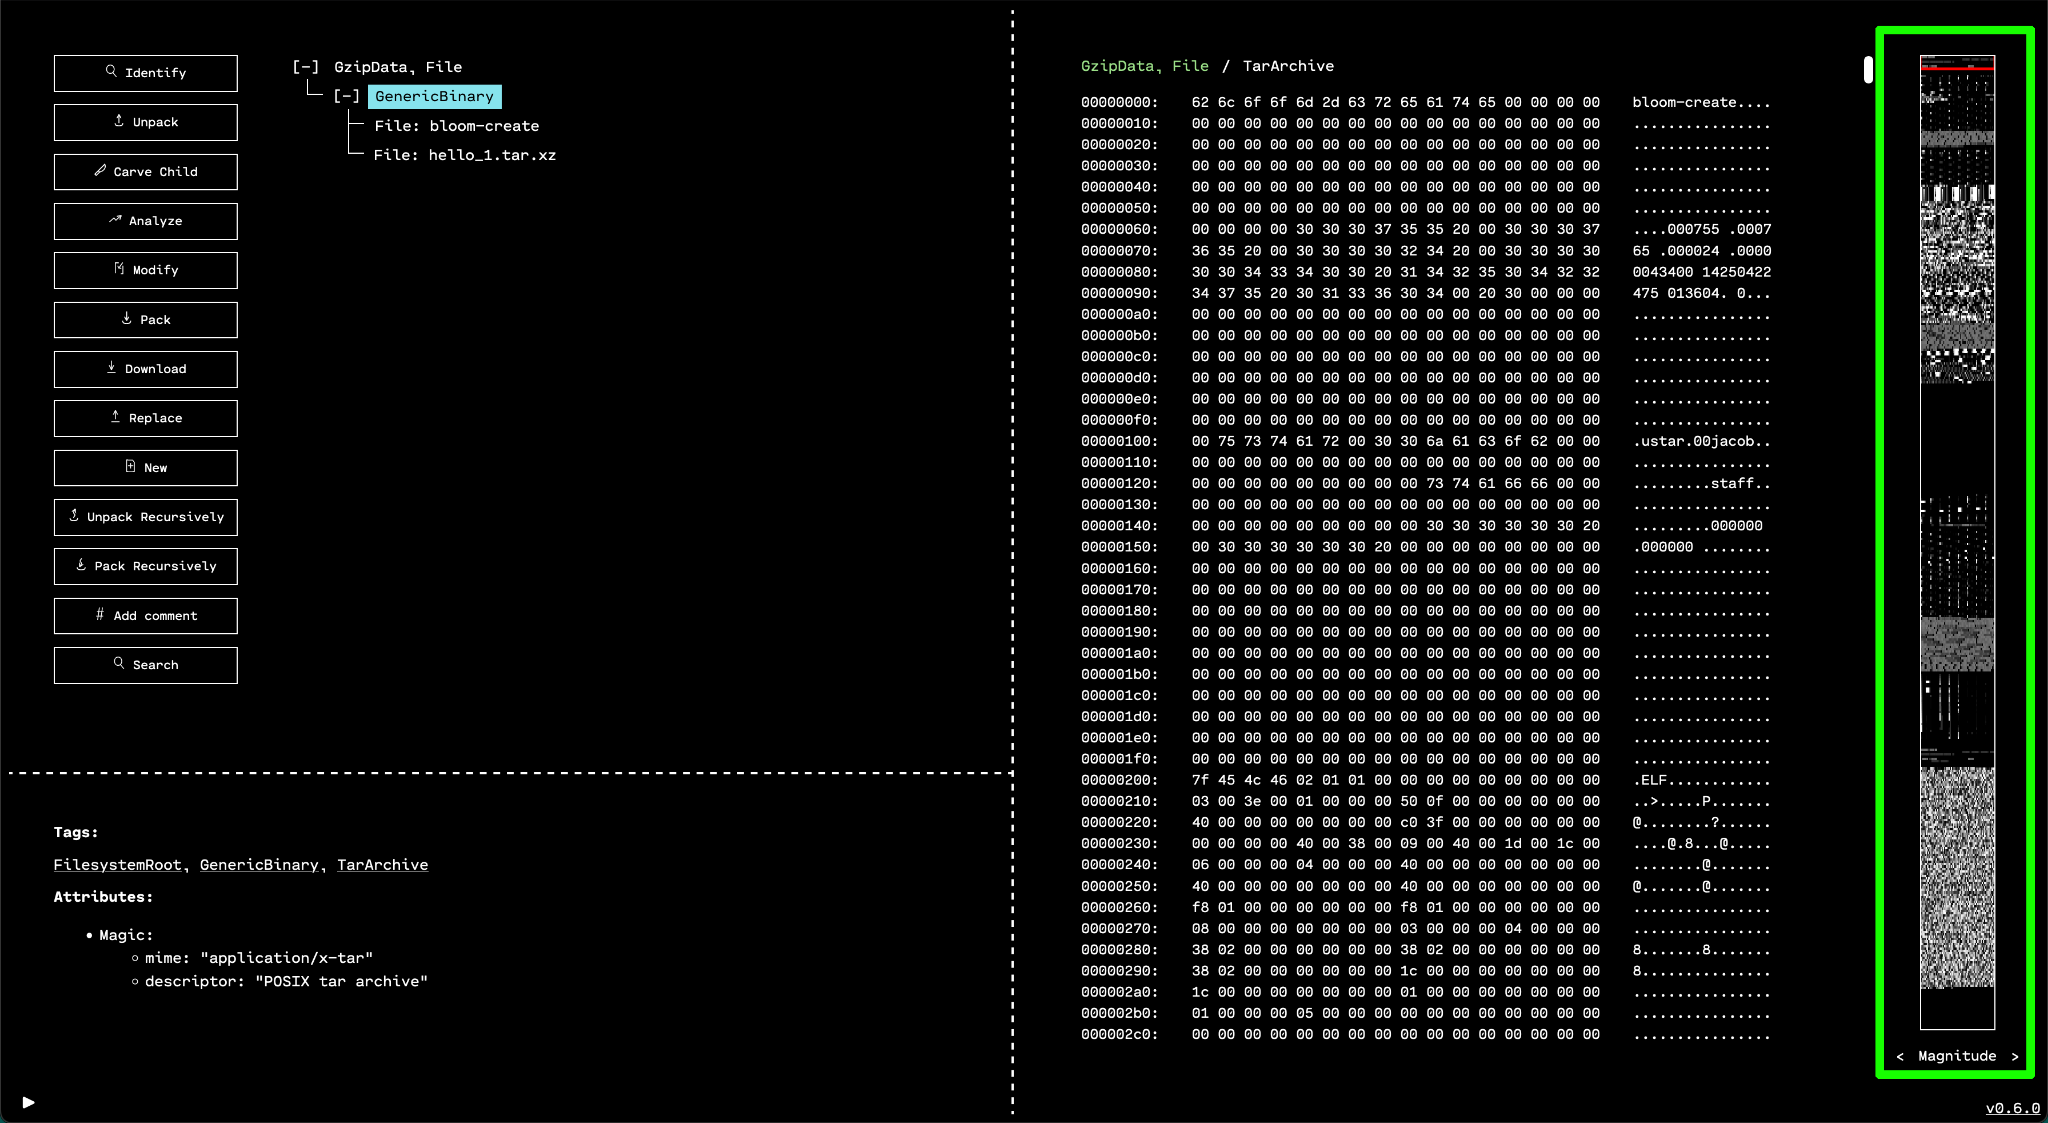
Magnitude View
The default mode of the minimap is "magnitude view" mode. In this simple mode,
each byte of the data is mapped to a grayscale color. Lower byte values create
darker pixels. For example the minimum byte value of 0x00 (0) maps to pure
black, and the maximum byte value of 0xFF (255) maps to pure white. The
values in between map to corresponding shades of gray.
Byteclass View
The minimap's "byteclass view" mode is very similar to the magnitude view. Like the magnitude view, the color of each pixel is based on the value of its corresponding byte. Unlike the magnitude view, byte values are grouped into discrete buckets called "byteclasses."
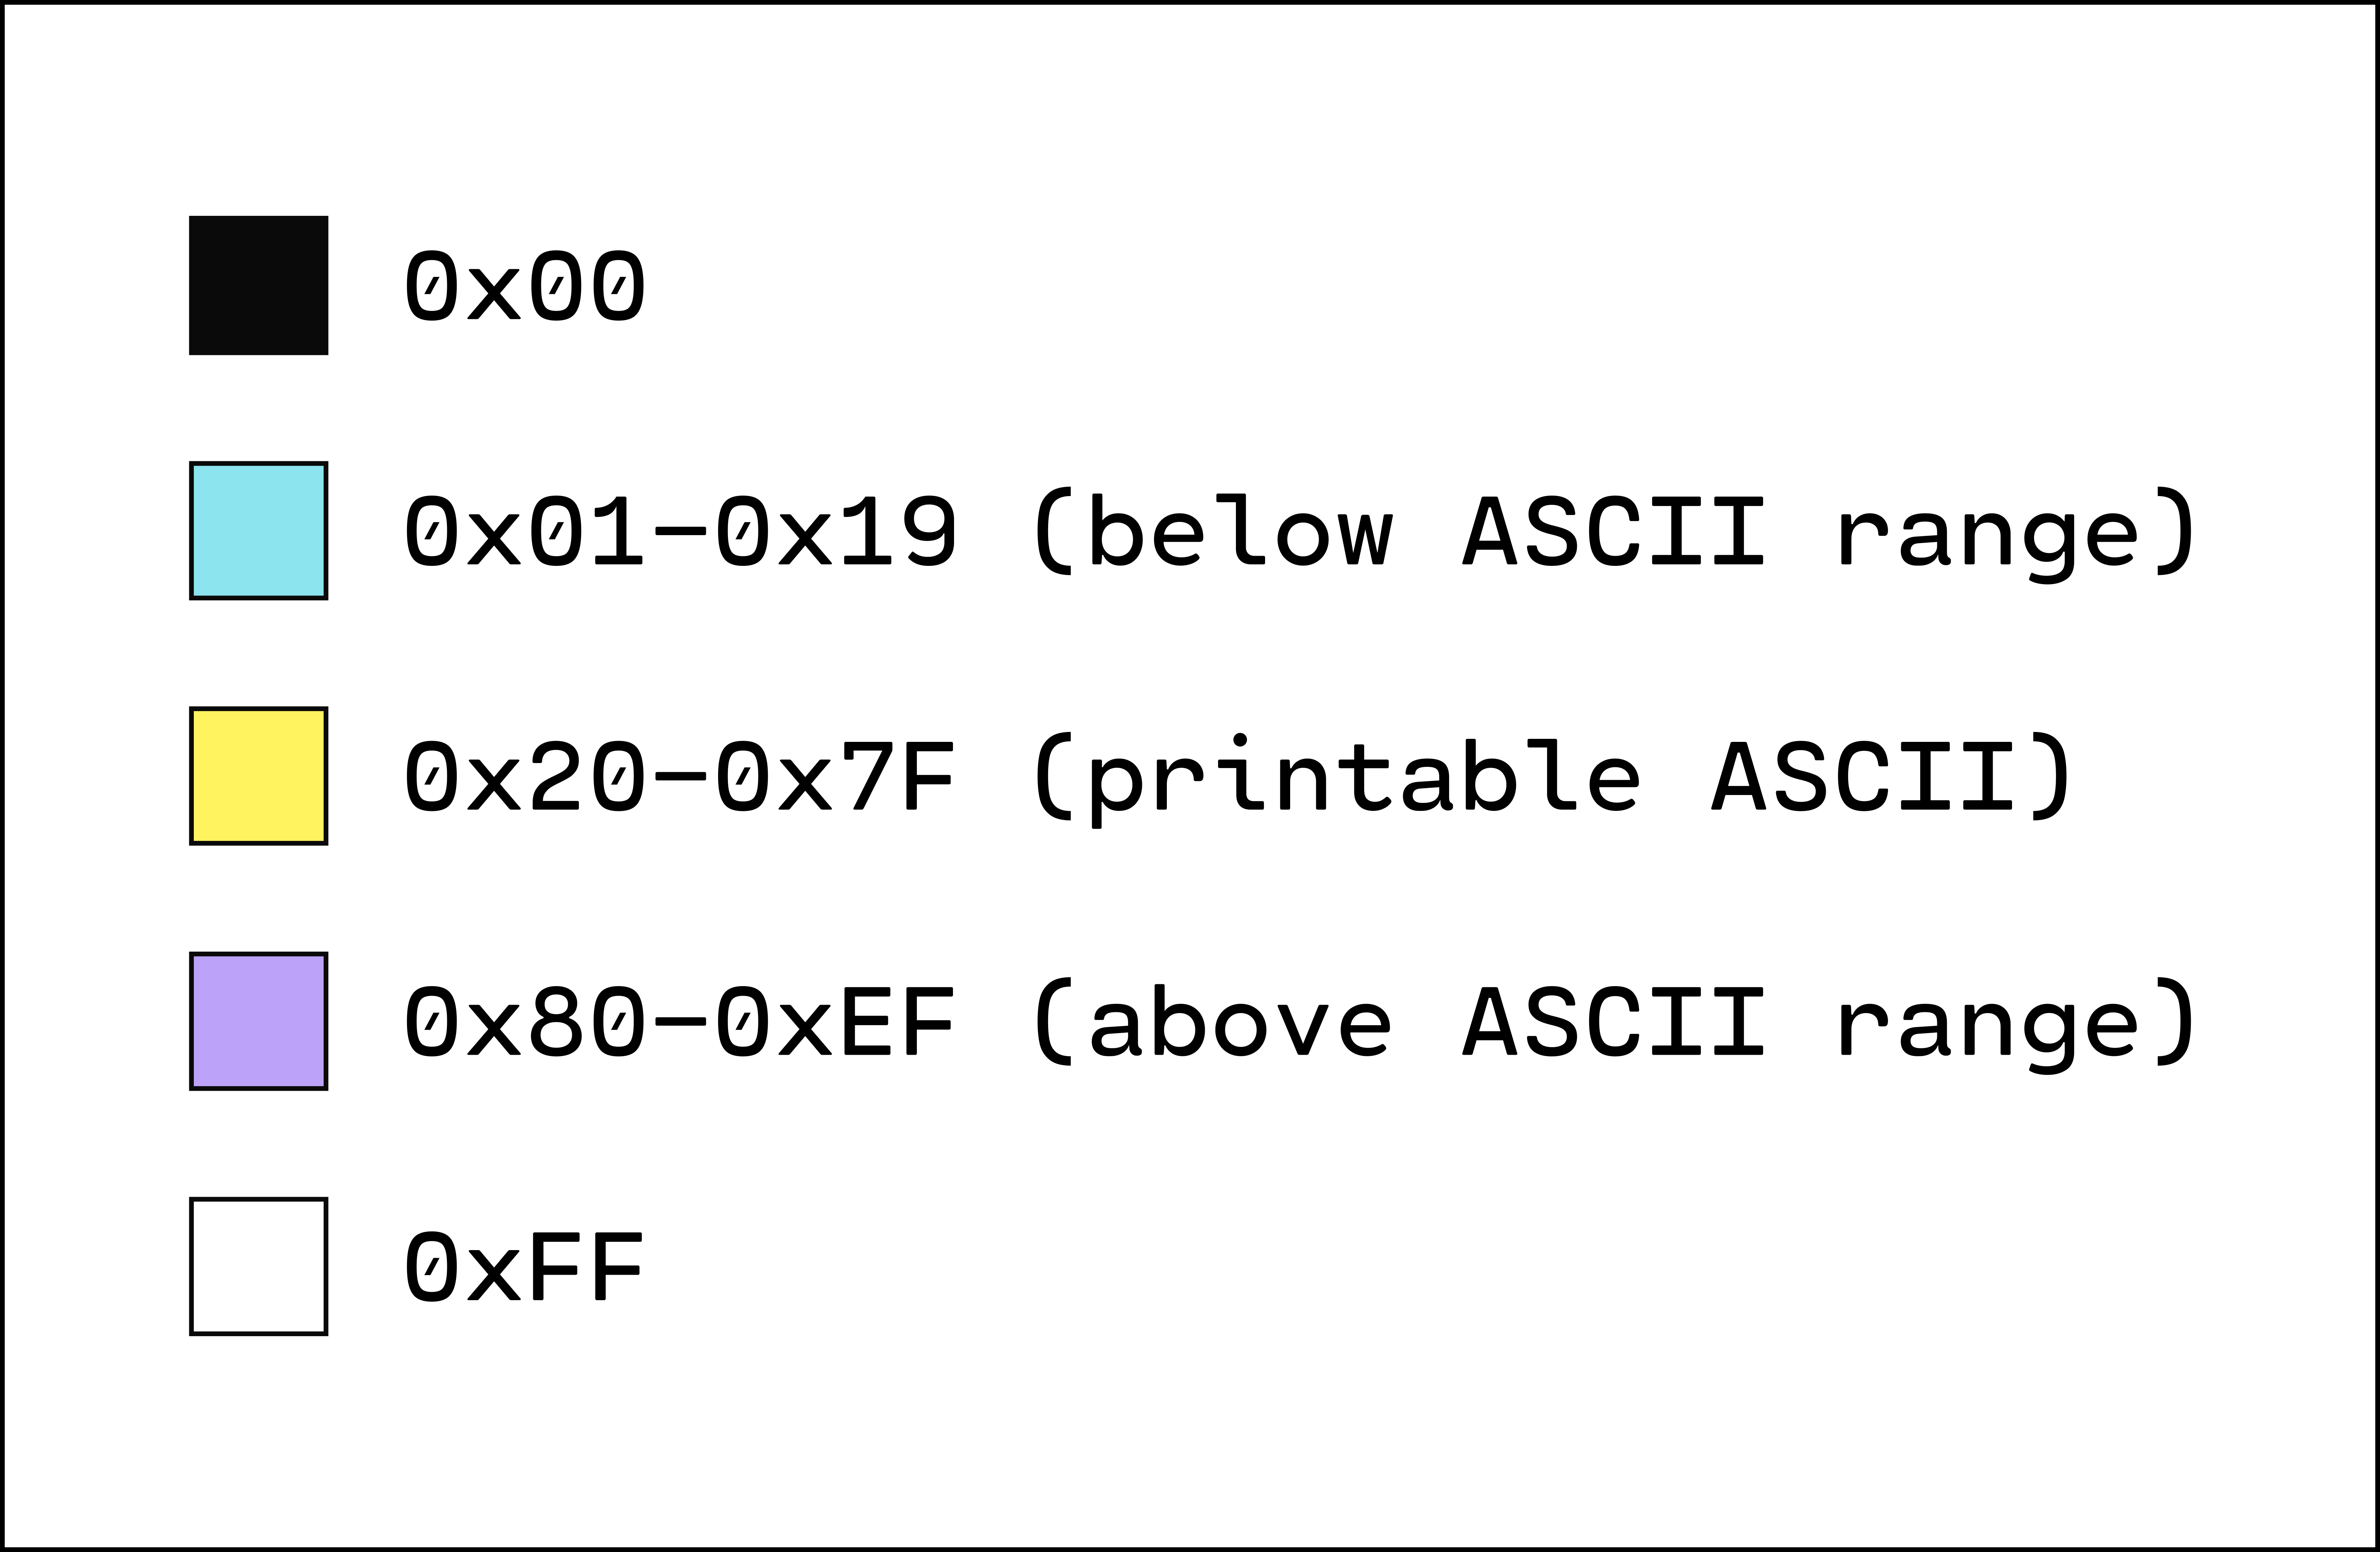
Byteclass mode is most useful for quickly finding strings by looking for yellow regions of the data with values in the ASCII range. Both magnitude mode and byteclass mode are also handy for identifying padding regions, headers, and data (such as symbols) that are aligned at regular intervals.
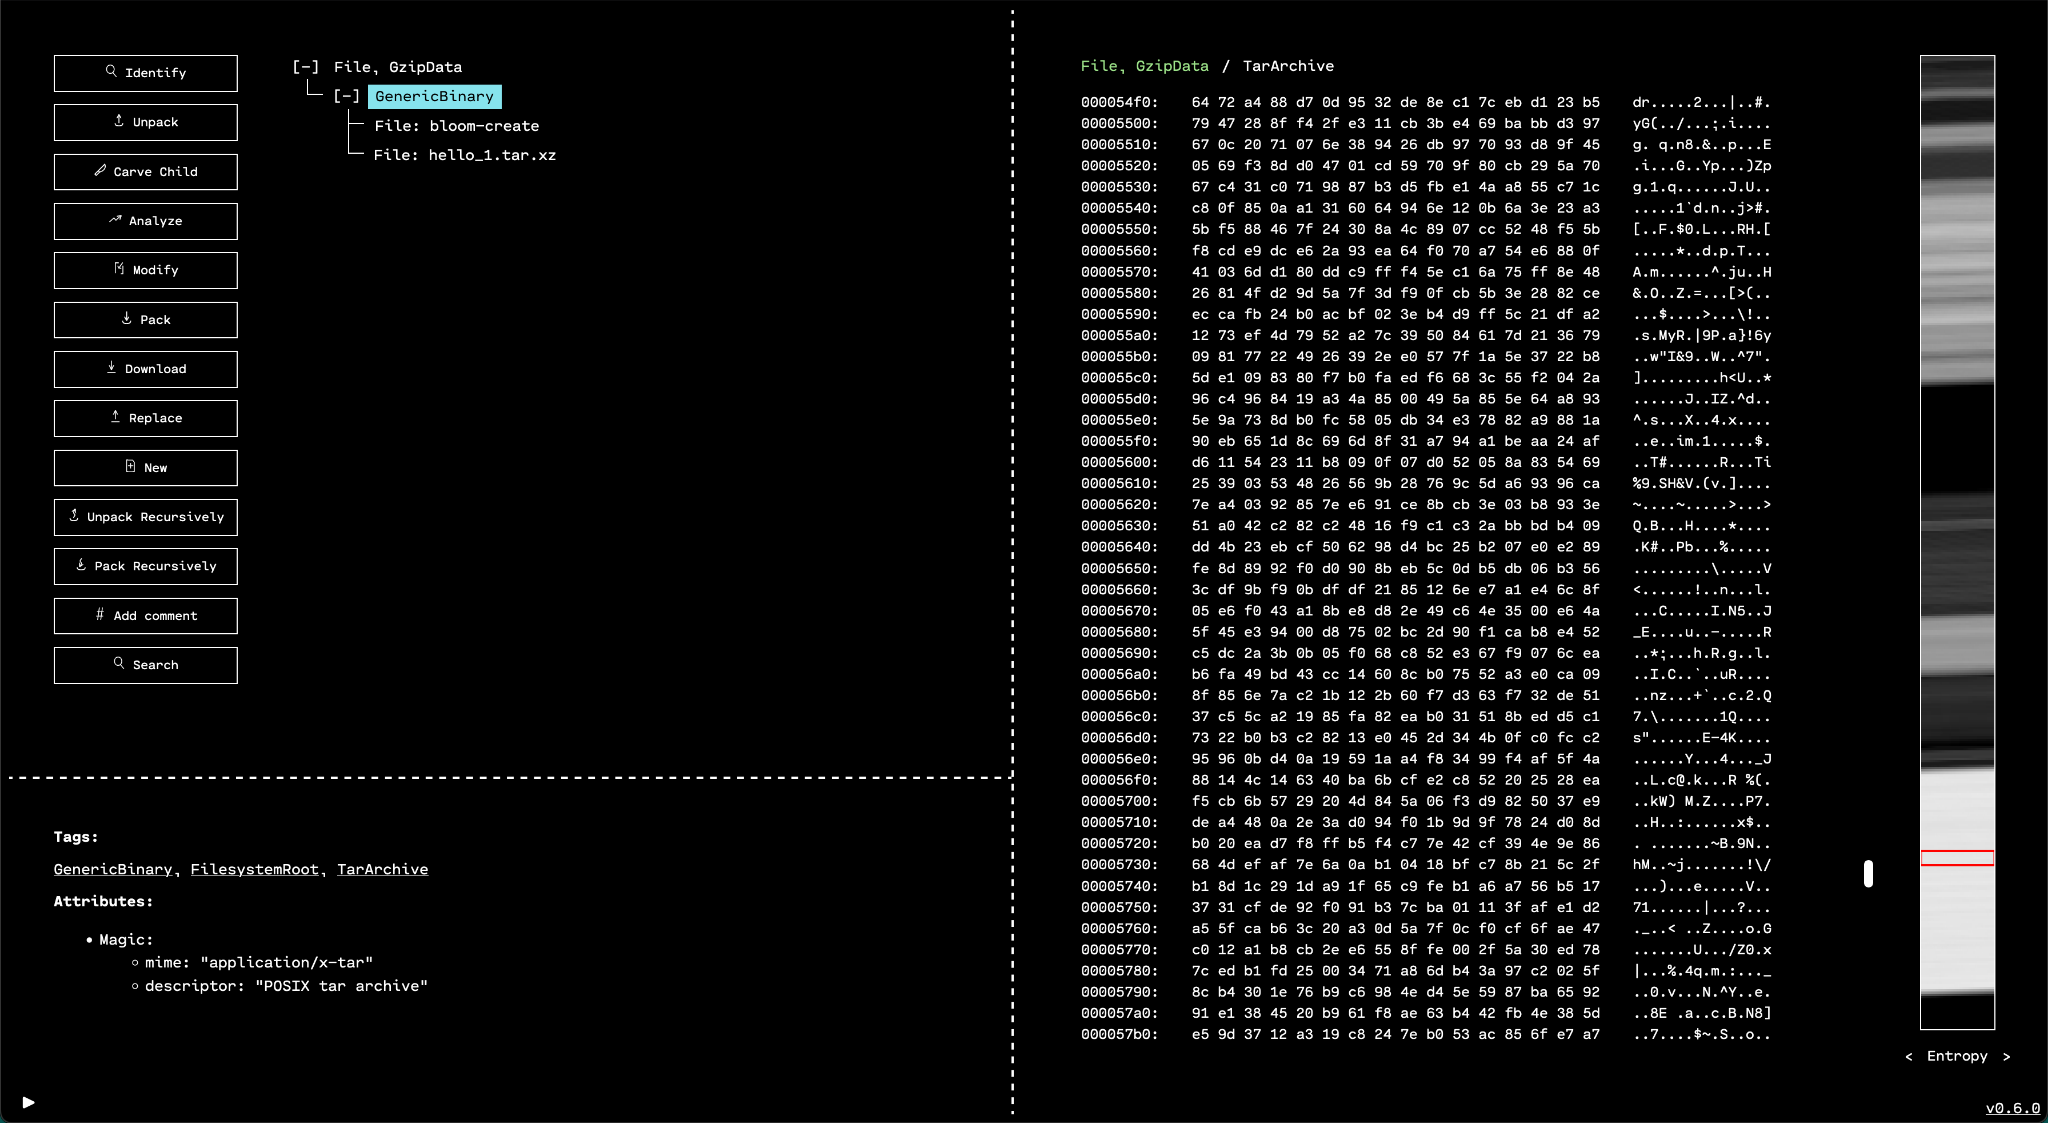
Entropy View
The minimap's "entropy view" mode displays regions with highly random data across the binary. This is particularly useful for finding compressed and encrypted data ranges.
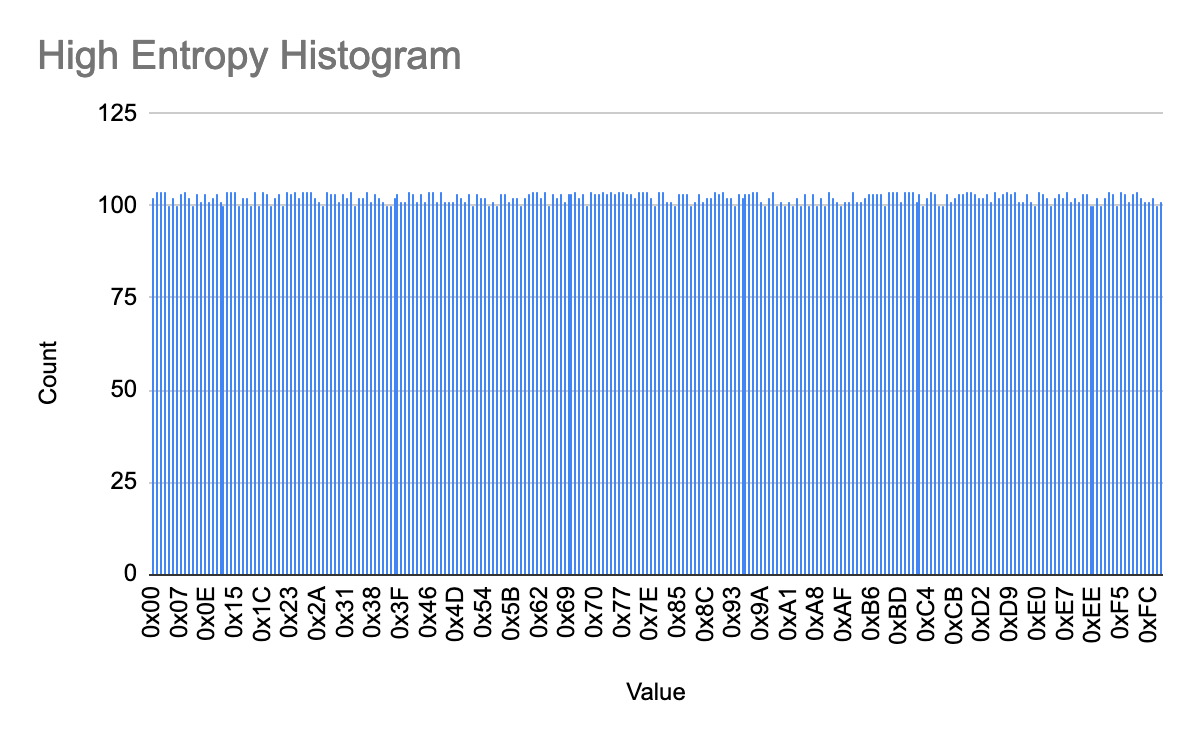
Shannon entropy, named for Claude Shannon, is a fundamental concept from information theory that is used to characterize how random and unpredictable the information in a sample of bytes is. Intuitively, the Shannon entropy of a probability distribution quantifies how close that distribution is to uniformly random. In concrete terms, if you make a histogram of the byte occurrences in a range of data, the entropy of that histogram is a measure of how flat the bars are. For example:
- The bars in this histogram are very flat since each byte is approximately equally likely to occur. Thus, this data has high entropy -- the bytes are very random.
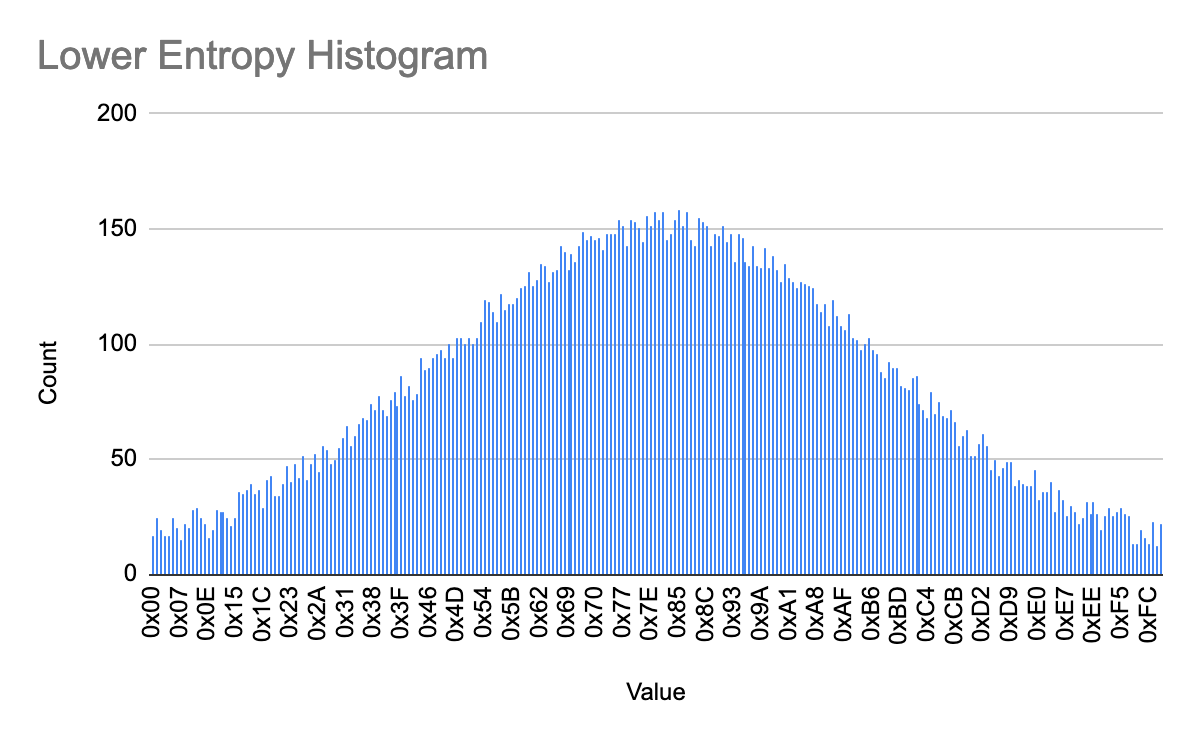
- The bars in this histogram show that some bytes are much more likely to occur than others. Even though every byte value has some chance of occurring, the values at the middle of the range are more likely, and more predictable. Thus, this data range is less random, and therefore lower entropy, than the first.
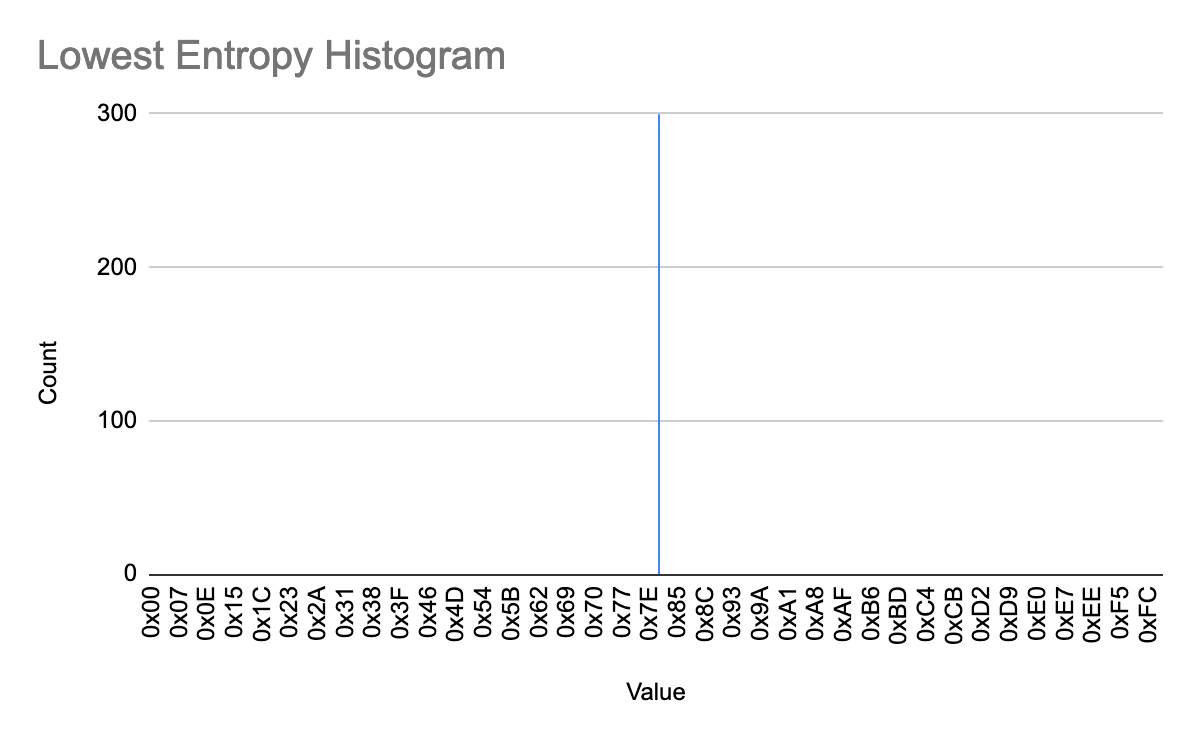
- There is only one bar in this histogram -- this range of data consists entirely of one repeating byte value. Thus, this data is entirely predictable, and has the lowest possible entropy value: 0.
Since Shannon entropy gives concrete, numerical bounds on how random or predictable a sample of data can be, it becomes possible to calculate and visualize the relative levels of randomness between regions of data. Simply compute a byte occurrence histogram across a region, then calculate the entropy of the distribution and compare. The entropy view in the OFRAK GUI does exactly this.
Specifically, in OFRAK, entropy is calculated over a 256-byte sliding window
that moves forward by one byte for each pixel in the minimap. The calculated
entropies are mapped to values between 0x00 and 0xFF with higher entropy
corresponding to lighter gray pixels and lower entropy corresponding to darker
gray pixels, as in the magnitude mode.
Since compressed and encrypted data generally have high entropy, this minimap view makes it easy to find and navigate to such data.